Demo 3 · Monthly health paid-claims triangles
This demo applies the traditional actuarial triangle structure at monthly frequency. It generates synthetic paid-claims data, builds incremental and cumulative triangles, selects monthly age-to-age factors, and estimates ultimate and IBNR using Chain Ladder.
Default design
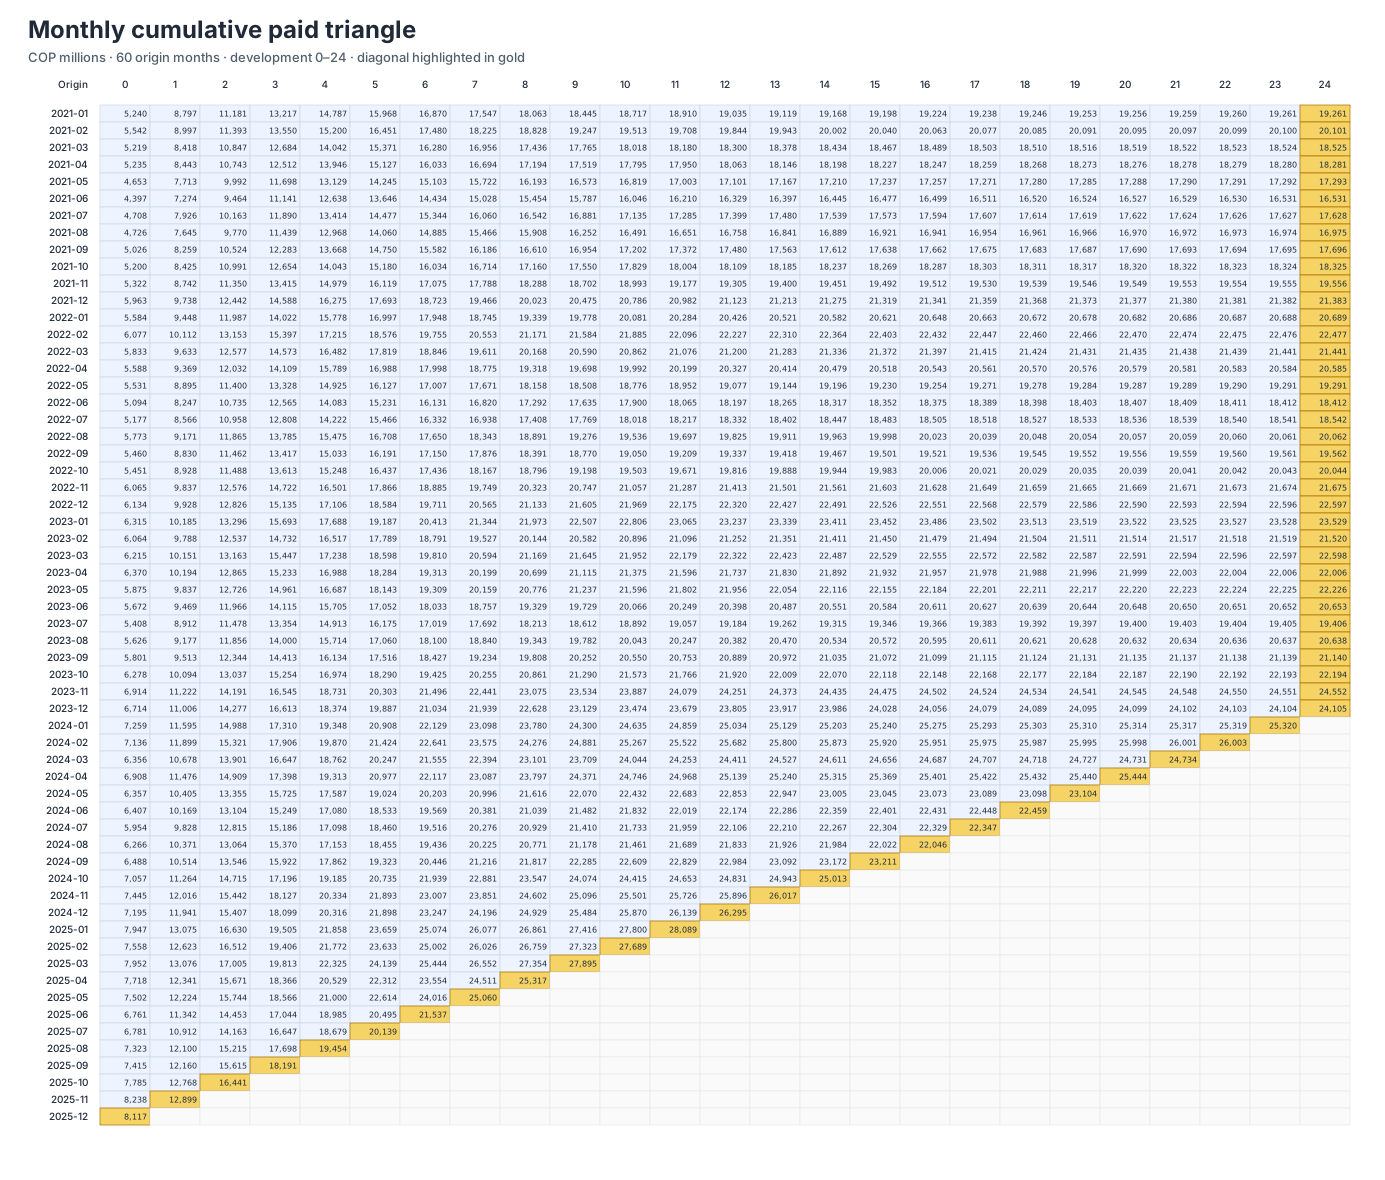
The example uses 60 origin months —five years— and development ages 0–24 months. The longest link, 23→24, therefore retains 36 complete observations.
1. Why 60 origin months and 24 development months
There is no universal number of months that makes Chain Ladder appropriate. Actuarial standards require data, experience periods, runout, methods and assumptions to be suitable for the intended purpose and development characteristics; they do not prescribe a fixed combination such as 60/24.
For this demo, 60/24 is a practical starting point because:
- five years provide repeated annual-seasonality cycles;
- 24 months capture a reasonable tail for fast- or medium-maturing health claims;
- 36 origin months are fully developed;
- every monthly factor has at least 36 observations under the default design;
- the visual remains reviewable and the observed diagonal can be audited.
Actual selection must be segment-specific. High-cost, disputed, litigated, late-billed or operationally unstable claims may require 36 months or more, a tail factor, or a complementary method.
2. Traditional triangle layout
Rows are occurrence months and columns are development months. The gold diagonal contains the latest observation for each origin month; blank cells represent future payments to be estimated.
Development age is the calendar-month difference between payment month and origin month:
3. Maturity curve
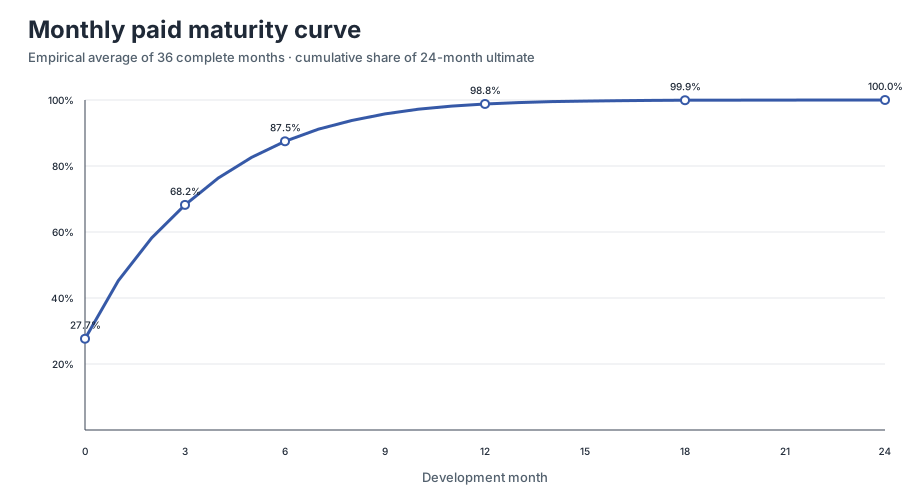
The generator knows the synthetic ultimate and measures cumulative paid emergence at each age. The curve helps assess whether 24 months is reasonably mature for the simulated pattern.
In production, this assessment should be repeated by population, coverage, provider, payment model and claim type. An aggregate curve can hide material long tails in small segments.
4. Sufficiency by factor
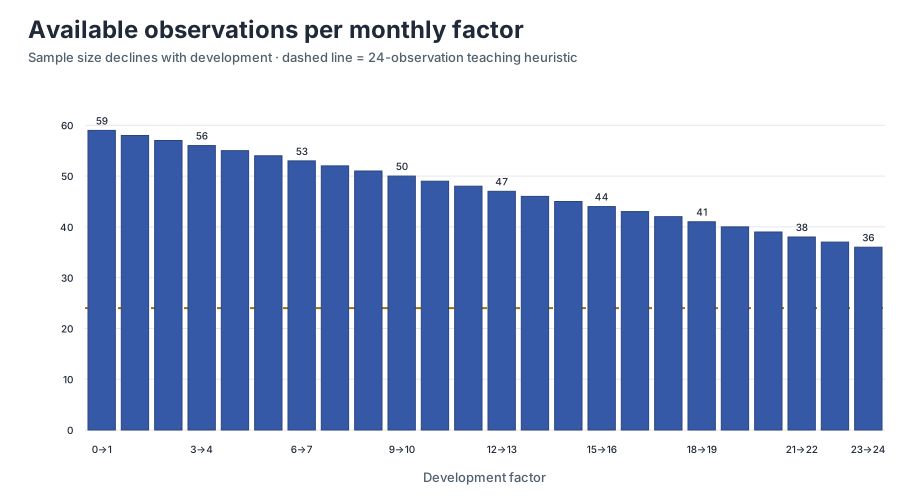
Available information declines as development age increases. Counting 60 rows is not enough: review how many observations support each factor.
The 24-observation line is a teaching heuristic for this demo, not an actuarial standard. data_sufficiency_diagnostics.csv makes this distinction explicit.
5. Generated files
English outputs are written to data/demo_monthly_triangles/:
| File | Content |
|---|---|
monthly_paid_claims_long.csv |
Observed cells in long format |
monthly_paid_incremental_triangle.csv |
Monthly paid amounts by origin and development |
monthly_paid_cumulative_triangle.csv |
Cumulative paid in actuarial format |
monthly_age_to_age_factors.csv |
Factors, CDFs, dispersion and counts |
monthly_chain_ladder_results.csv |
Ultimate, IBNR and error versus simulated truth |
data_sufficiency_diagnostics.csv |
History, horizon and observation controls |
run_summary.txt |
Parameter and result summary |
Equivalent Spanish files are generated under data/demo_triangulos_mensuales/.
6. Run the demo
From the repository root:
English only:
The valuation month and seed are configurable:
python scripts/generate_demo_monthly_triangles.py \
--valuation-month 2025-12 \
--origin-months 60 \
--development-months 24 \
--seed 20260714
A horizon other than 24 months is deliberately rejected: the emergence pattern, controls and documentation must be revised before extending the model.
7. Reproducibility checks
The generator stops if these reconciliations fail:
- 60 origin months under the default design;
- 1,200 observed cells;
- incremental amounts sum to every cumulative cell;
- full increments sum to simulated ultimate;
- the longest-link count equals the number of complete origins;
- identical outputs for the same seed.
Validate the full repository with:
python tests/test_demo_monthly_triangles.py
rm -rf site
python scripts/audit_docs.py
python scripts/preflight_release.py
python -m mkdocs build --strict
8. Before using real data
- Define occurrence and payment dates precisely.
- Segment material changes in coverage, population, networks, rates and operations.
- Assess medical trend and seasonality on the calendar axis.
- Review individual link ratios, not only the volume-weighted average.
- Exclude or segment outlier months only with documented rationale.
- Test stability with rolling windows and backtesting.
- Estimate a tail when 24 months is not sufficiently mature.
- Reconcile results with accounting, exposure and claim systems.
Professional use
All data are synthetic. The 60/24 design, 24-observation threshold and demo results are educational and do not replace documented actuarial judgment.