Practical demo of simulated health claims triangles
This demo turns development triangle theory into a reproducible exercise. The goal is for the repository to work not only as a conceptual handbook, but also as a practical base for running models, validating assumptions, and showing results.
The Spanish output is the primary version for the Colombian context. This English version is included for bilingual use, documentation, teaching, and collaboration.
What the demo generates
The script generates:
- observed long-format paid claims by origin year and development age;
- paid incremental triangle;
- paid cumulative triangle;
- volume-weighted age-to-age factors;
- ultimate and IBNR estimates by origin year;
- execution summary;
- SVG visualization of the traditional actuarial triangle.
The data are synthetic and do not represent real experience from any insurer, EPS, provider, benefit administrator, or specific portfolio.
Recommended execution
From the repository root:
By default, two outputs are generated:
To generate only Spanish:
To generate only English:
English output files
data/demo_triangles/demo_health_paid_claims_long.csv
data/demo_triangles/paid_incremental_triangle.csv
data/demo_triangles/paid_cumulative_triangle.csv
data/demo_triangles/age_to_age_factors.csv
data/demo_triangles/chain_ladder_results.csv
data/demo_triangles/run_summary.txt
data/demo_triangles/paid_cumulative_triangle_actuarial_format.md
data/demo_triangles/paid_incremental_triangle_actuarial_format.md
docs/assets/demo_triangles/paid_cumulative_triangle.svg
docs/assets/demo_triangles/paid_incremental_triangle.svg
Traditional actuarial triangle visualization
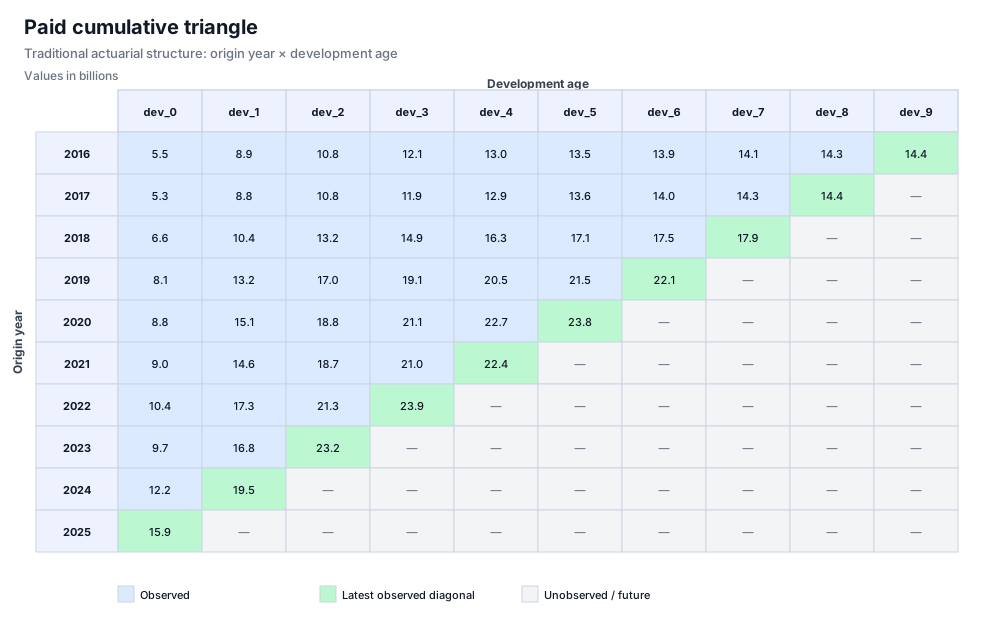
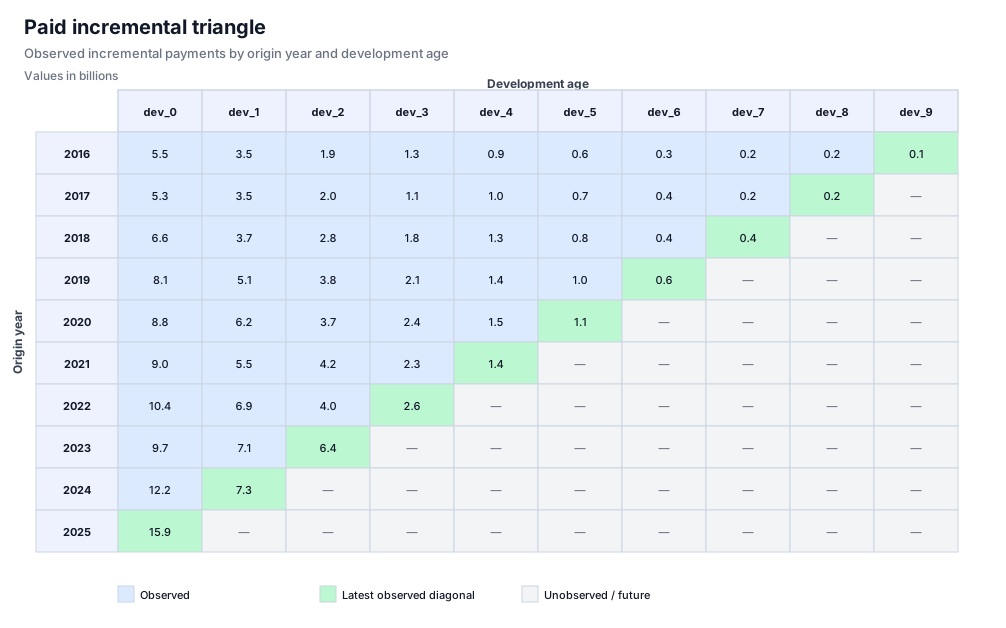
In actuarial reserving, the most recognizable format is the triangle with origin years in rows and development ages in columns. Observed cells form a diagonal: older years have more observed development ages and recent years are less mature.
The demo generates this view for the cumulative paid triangle:
It also generates the incremental version:
The practical reading is direct:
- blue cells are available historical observations;
- the green diagonal marks the latest available observation for each origin year;
- gray cells represent unobserved future periods;
- IBNR exists because the gray area must be estimated using development patterns.
Actuarial logic
The demo follows this flow:
- Simulate origin years.
- Assign exposure in member-months.
- Simulate frequency, severity, medical trend, and morbidity mix.
- Apply a cumulative paid emergence pattern.
- Generate observed payments up to the valuation year.
- Build incremental and cumulative triangles.
- Calculate volume-weighted age-to-age factors.
- Project ultimate using Chain Ladder.
- Calculate IBNR as ultimate minus observed cumulative paid.
Core formulas
For origin year \(i\) and development age \(j\), the selected age-to-age factor is:
where:
- \(C_{i,j}\) is cumulative paid for origin year \(i\) at development age \(j\);
- the sum uses only origin years with available observations at both \(j\) and \(j+1\).
The cumulative development factor to ultimate for an origin year with latest observed age \(k\) is:
Ultimate and IBNR are estimated as:
Expected interpretation
Older origin years should be almost fully developed. More recent origin years should have a larger undeveloped share and, therefore, larger estimated IBNR.
This pattern demonstrates three core ideas:
- the observed diagonal limits available information;
- development factors transfer historical emergence into immature origin years;
- IBNR increases when an origin year has lower observed maturity.
Limitations
This demo is intentionally simple:
- it does not estimate uncertainty;
- it does not calculate confidence intervals;
- it does not include bootstrap;
- it does not model denials, audit, recoveries, or administrative states;
- it does not separate paid and incurred triangles;
- it does not explicitly adjust for mix, contract, network, or regulatory changes.
These extensions remain open for future demos.
